Follow-up chest CT
The AI radiologist.
Radtechia reads each new CT against every earlier scan, finds and measures what changed, and drafts the report for the radiologist to sign.
The interactive demo opens on a laptop.
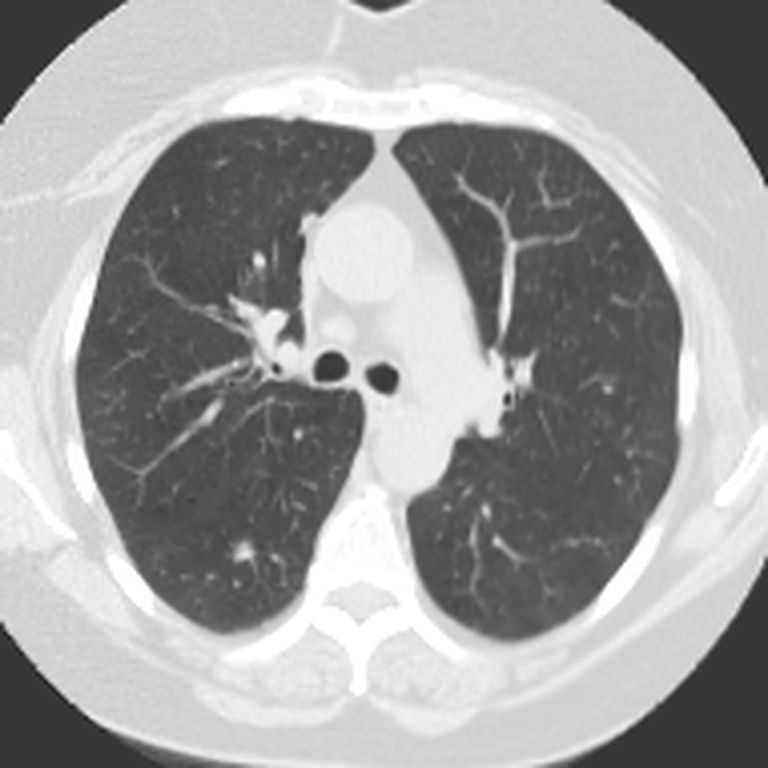
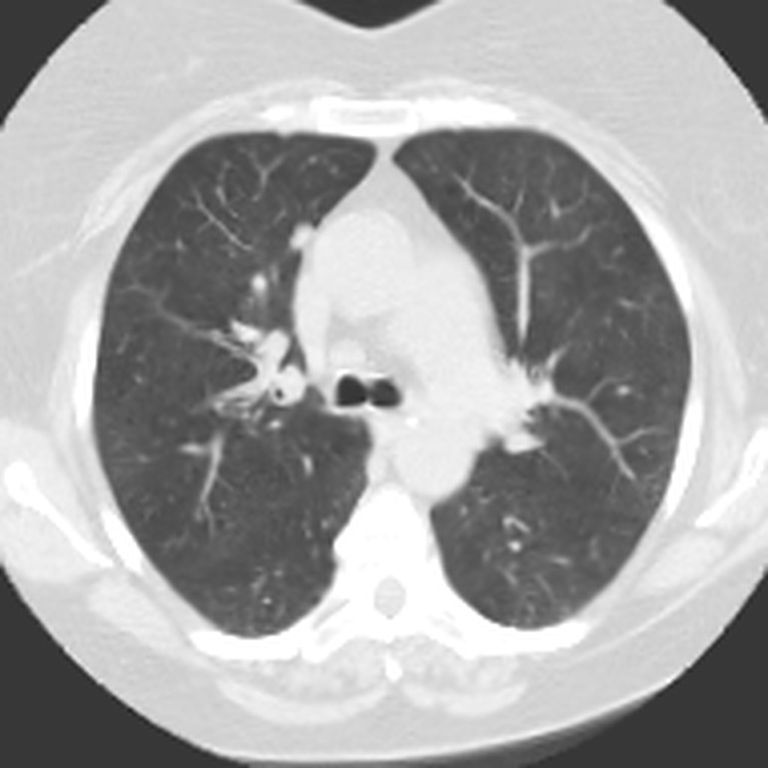
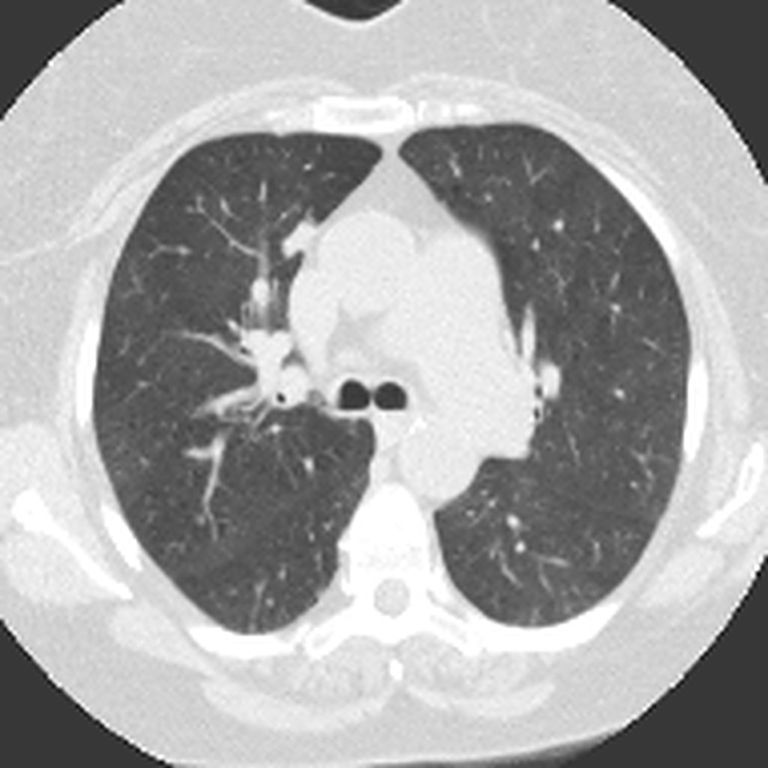
Right upper lobe nodule growing

What Radtechia does
Every prior, compared
Each new scan is aligned with all the earlier ones, not just the last.
Every finding, measured
Size, volume and growth for each finding, at every visit.
A draft ready to sign
Each sentence links to its images. The radiologist edits and signs.
How it works
01
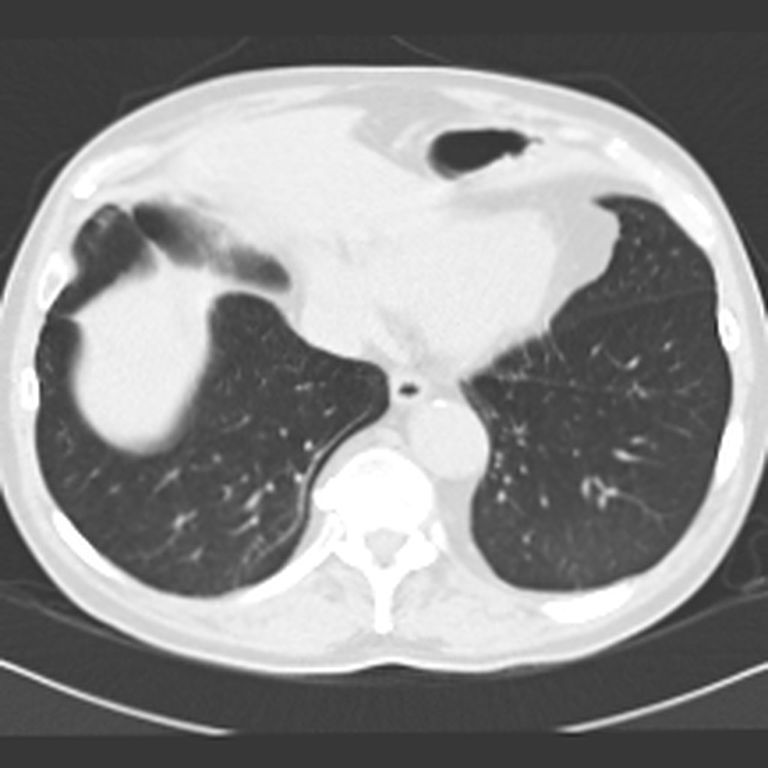
Pick the scan
Each one arrives already compared with the earlier ones.
Patient 1
Patient 3
02
See what changed
Every finding, most important first, with its status in one word.
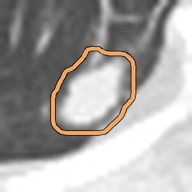 newRight lower lobe nodulenot seen → 7.8 mm
03
Click any number
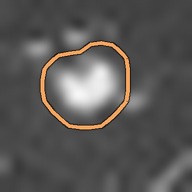
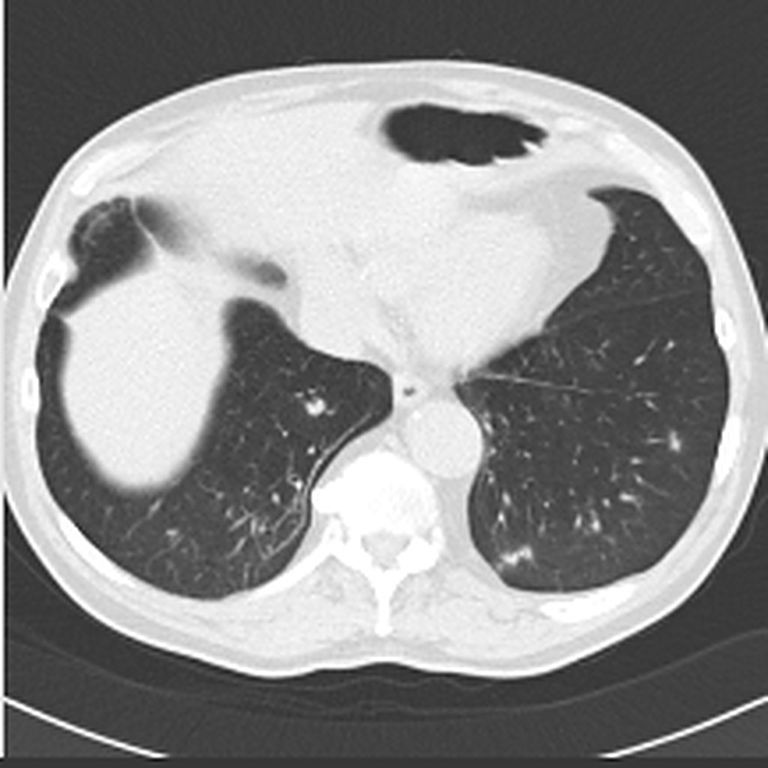
See its image at every visit, side by side. Dashed where it was not there.
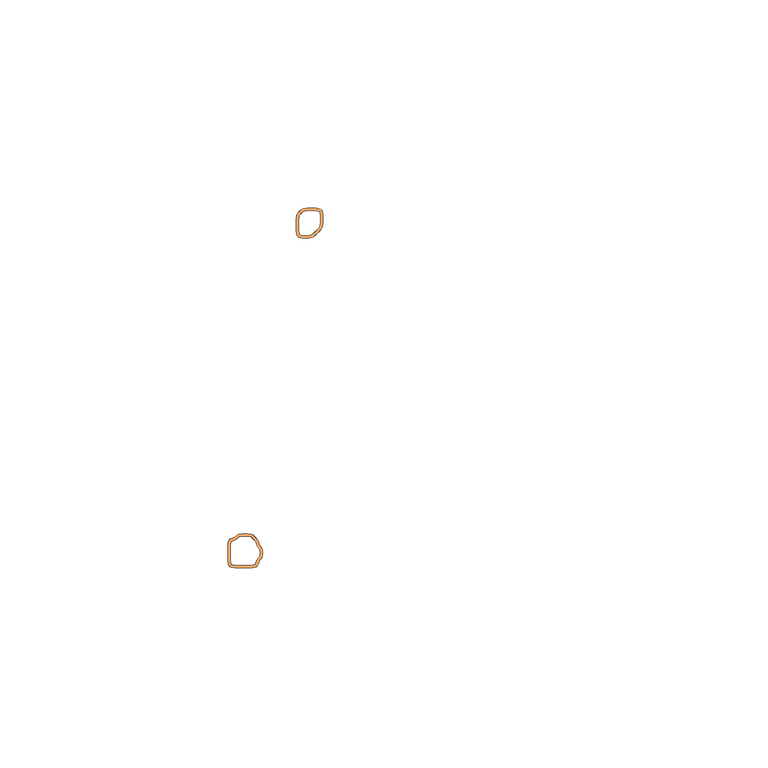
Right lower lobe nodule new

04
Sign
Edit a word if you like. Then sign. The signed report carries no product name.
Right upper lobe nodule: 17.1 × 10.1 mm (mean 13.6 mm), previously 10.8 × 7.9 mm (last year) and 7.5 × 4.5 mm (2 years ago). Volume 1347 mm³, +109% since last year; volume doubling time 344 days. Growing. ESTI 2025: growth (VDT under 500 days at 12 months or later).